The latest price. The bids and asks waiting right now. Finished trades, and candles that fold the last minute or hour into a handful of numbers. That stream is what a trading bot reads instead of a chart, and reading it is all a bot does before it decides anything. This article, Step 3 of the complete guide to algorithmic trading in crypto, is the map of that data: what each stream tells you, which ones your first bot needs, and how to get them without paying.
What data does a trading bot actually use?
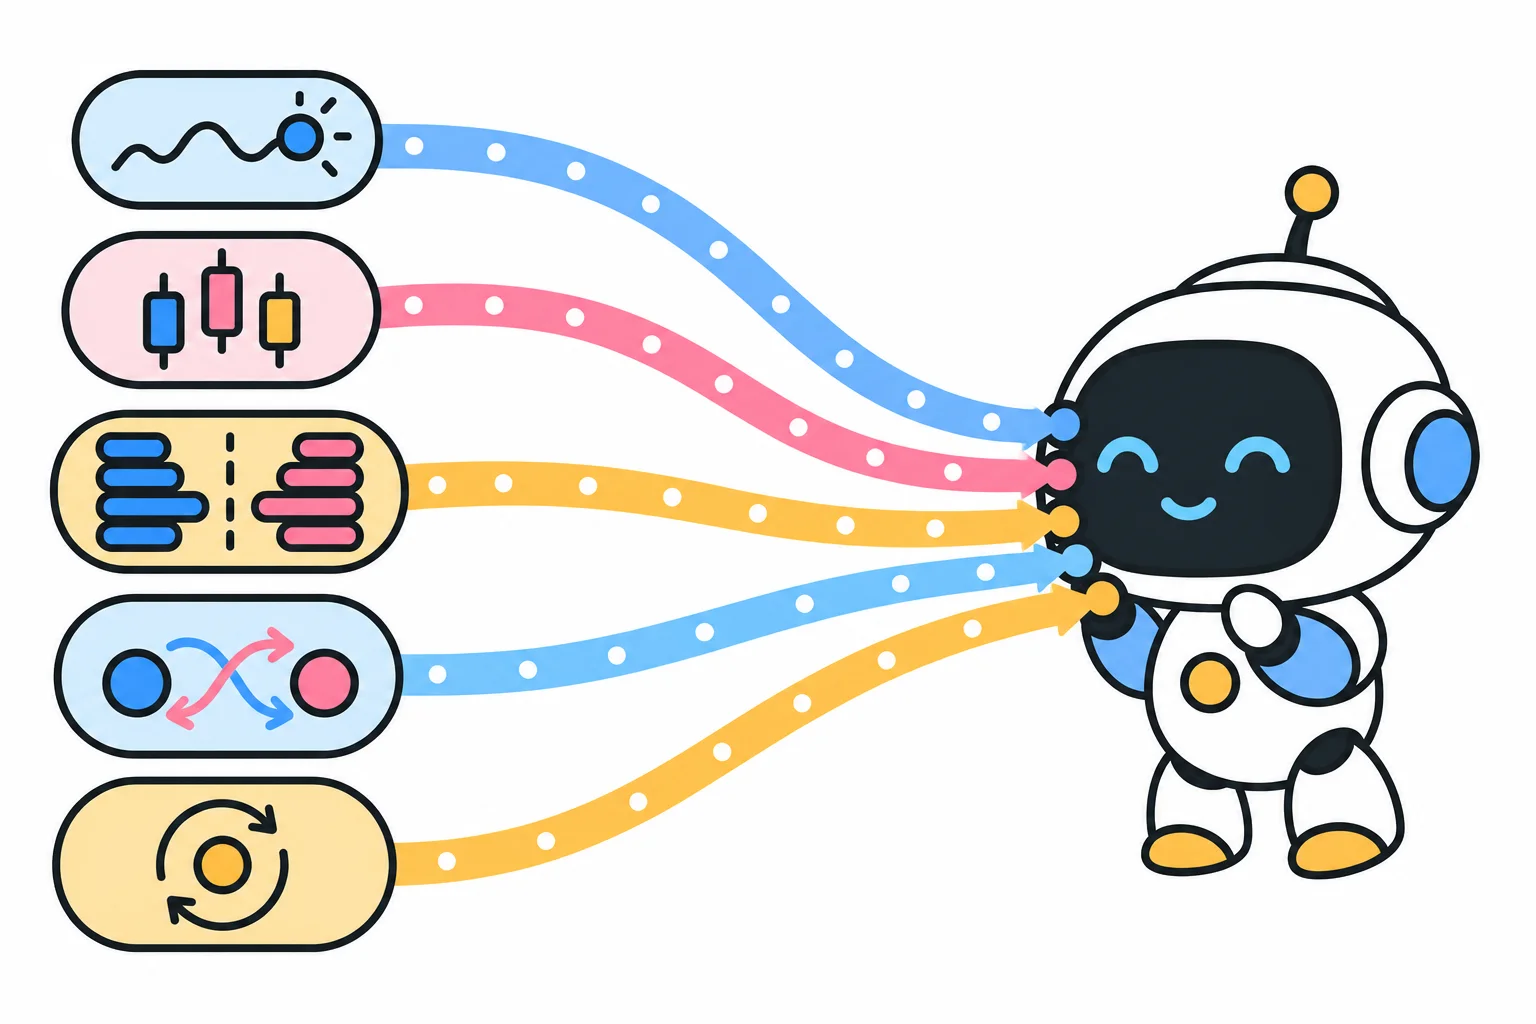
Five streams cover almost everything a retail bot reads.
The ticker is the headline: the latest traded price, usually with the current best bid and ask attached. Quick to fetch, enough for slow strategies.
Candles (also called OHLCV) compress a time window, say one minute or one hour, into five numbers: open, high, low, close, volume. They are the standard fuel for rule-based strategies and for backtesting.
The order book is the live list of buy and sell orders waiting at each price. It shows where the market’s supply and demand actually sit, and it is where your own orders will land.
Trades are the record of what actually happened: every completed transaction with its price, size, and time.
Funding rates exist on perpetual futures, the contract type where most crypto derivatives trading happens: a periodic payment between long and short holders that keeps the contract’s price near the spot price. If you trade perpetuals, funding quietly decides part of your profit.
Each of these has its own guide later in this series. For a first bot, candles plus the ticker are usually enough.
Prices are not one number
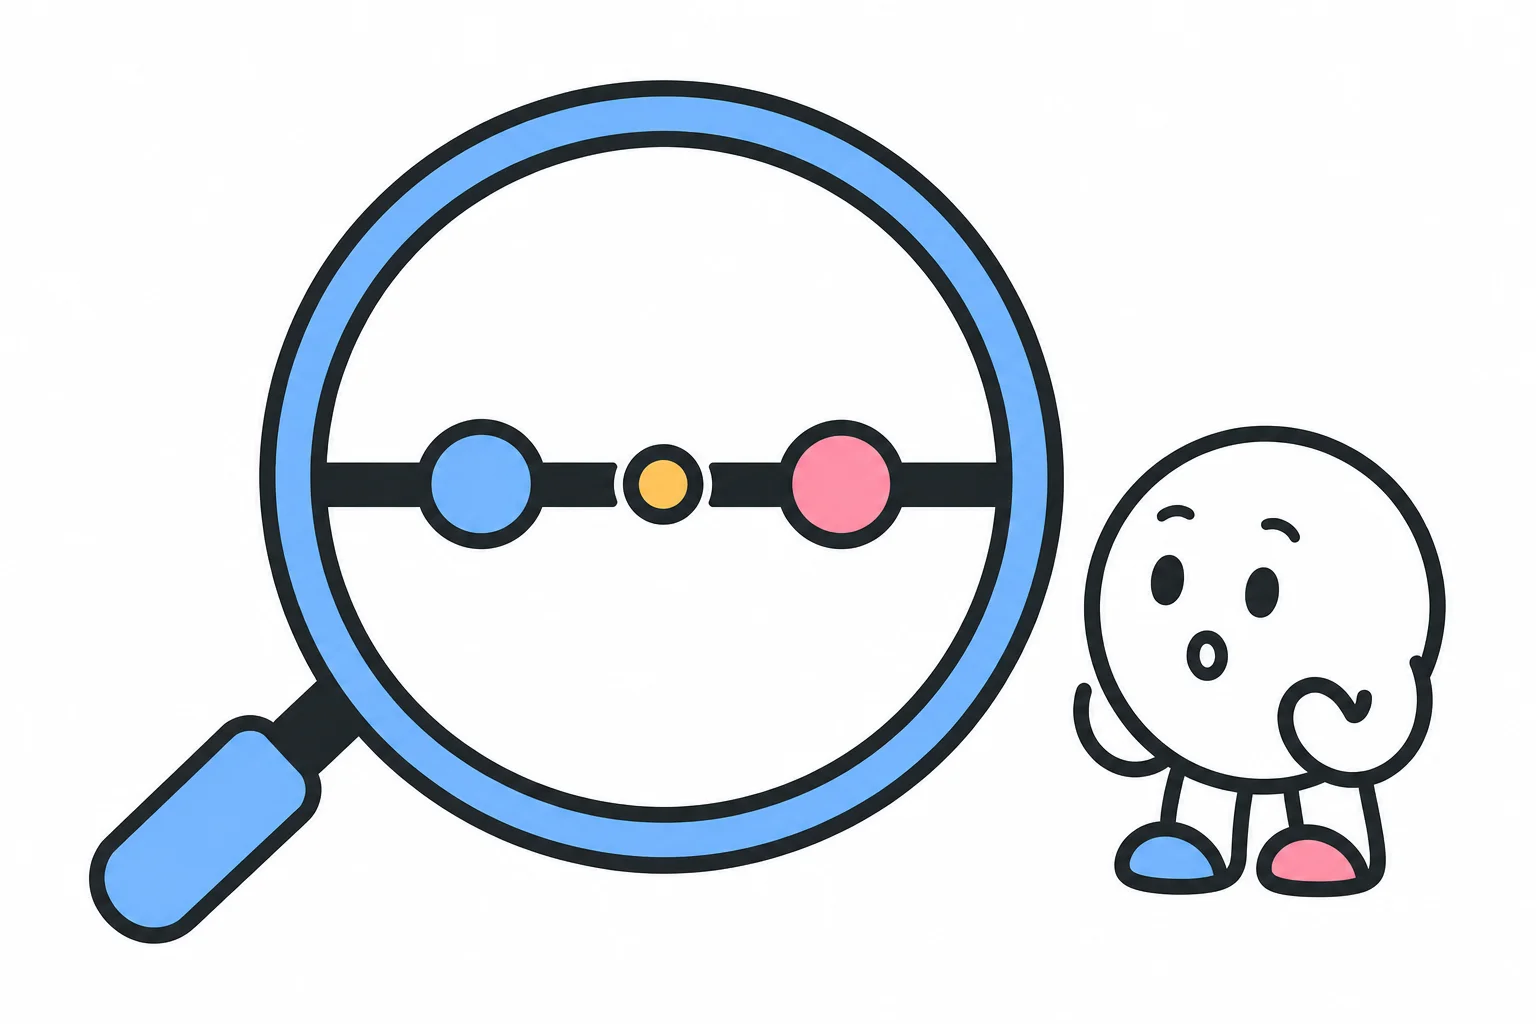
The first surprise for most beginners: there is no single “price of BTC.” At any moment an exchange has the highest price anyone will currently pay (the best bid), the lowest price anyone will currently sell at (the best ask), and the price of the last trade, which usually sits at or between the two. The gap between bid and ask is the spread, and it is a real cost: buy and immediately sell, and you lose the spread.
This matters for bots because a rule like “buy when the price drops 3%” has to define which price. Last trade? Best ask? Which one you choose changes when your orders fill and what price you pay. A backtest that measures one of these numbers while the live bot trades another will quietly disagree with reality.
Candles: the workhorse of bot data
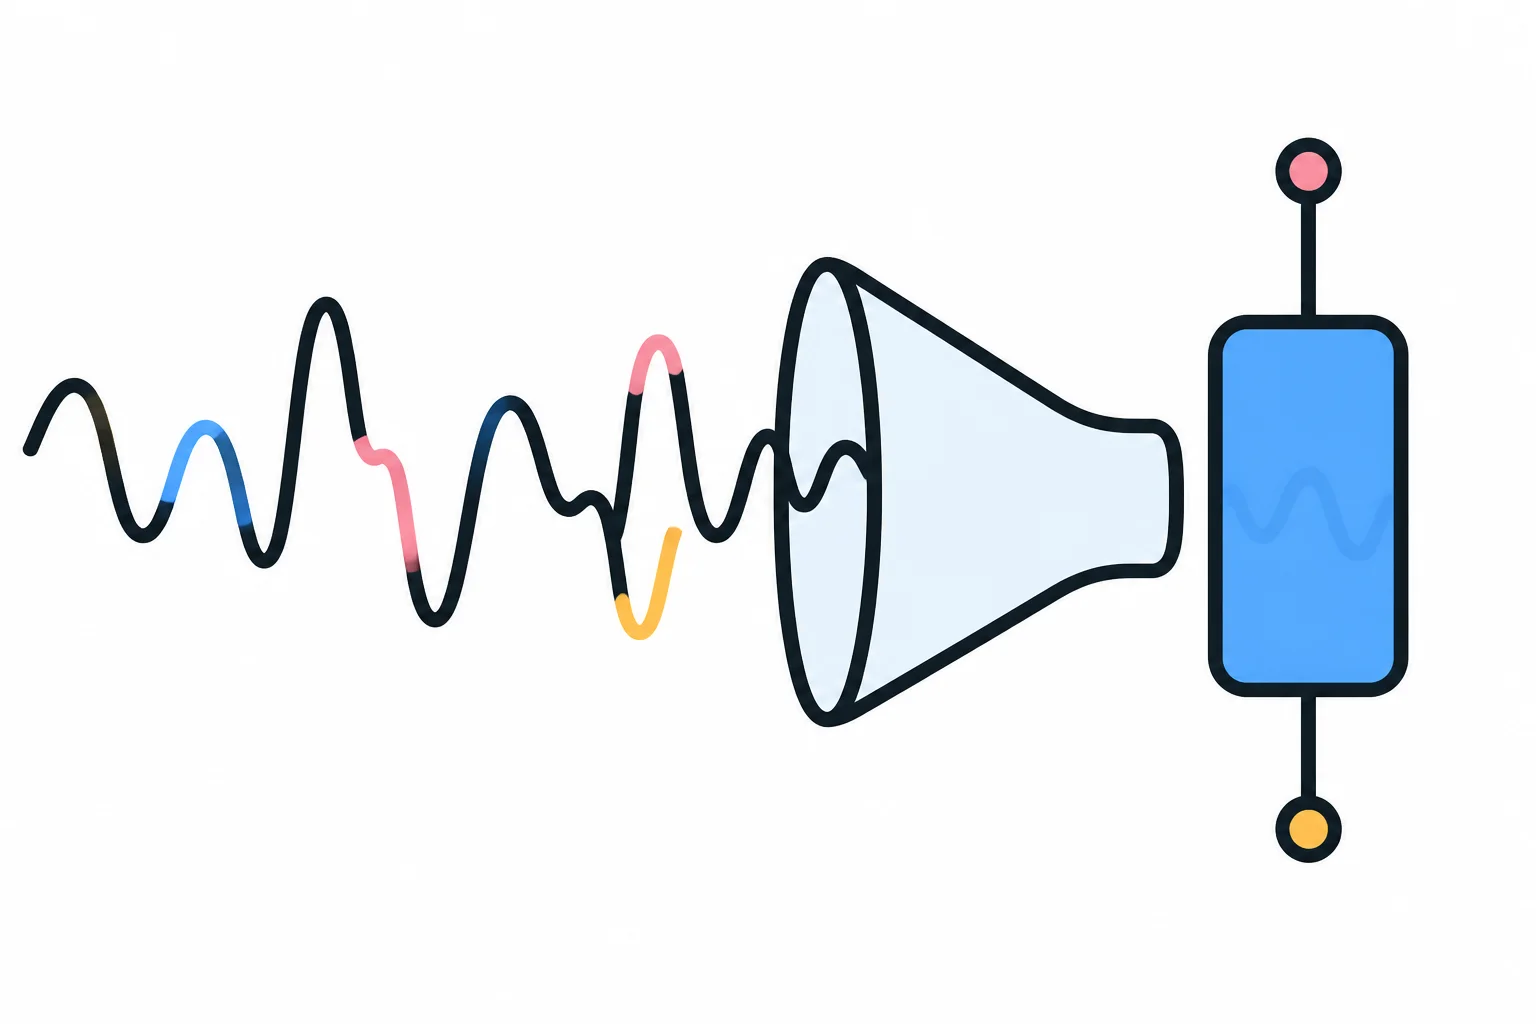
A candle answers five questions about a time window: where the price started, how high it went, how low it went, where it ended, and how much traded. That compression is why candles are everywhere: a year of hourly candles is under nine thousand rows, small enough to test ideas against in seconds.
The compression also hides things. Inside a single one-hour candle the price may have crashed and recovered; the candle shows only the start, the end, and the extremes. Fast strategies therefore use small candles or raw trades; slow strategies can work with big ones. Choosing the window size is one of the first real design decisions your bot forces on you.
The order book: where prices come from
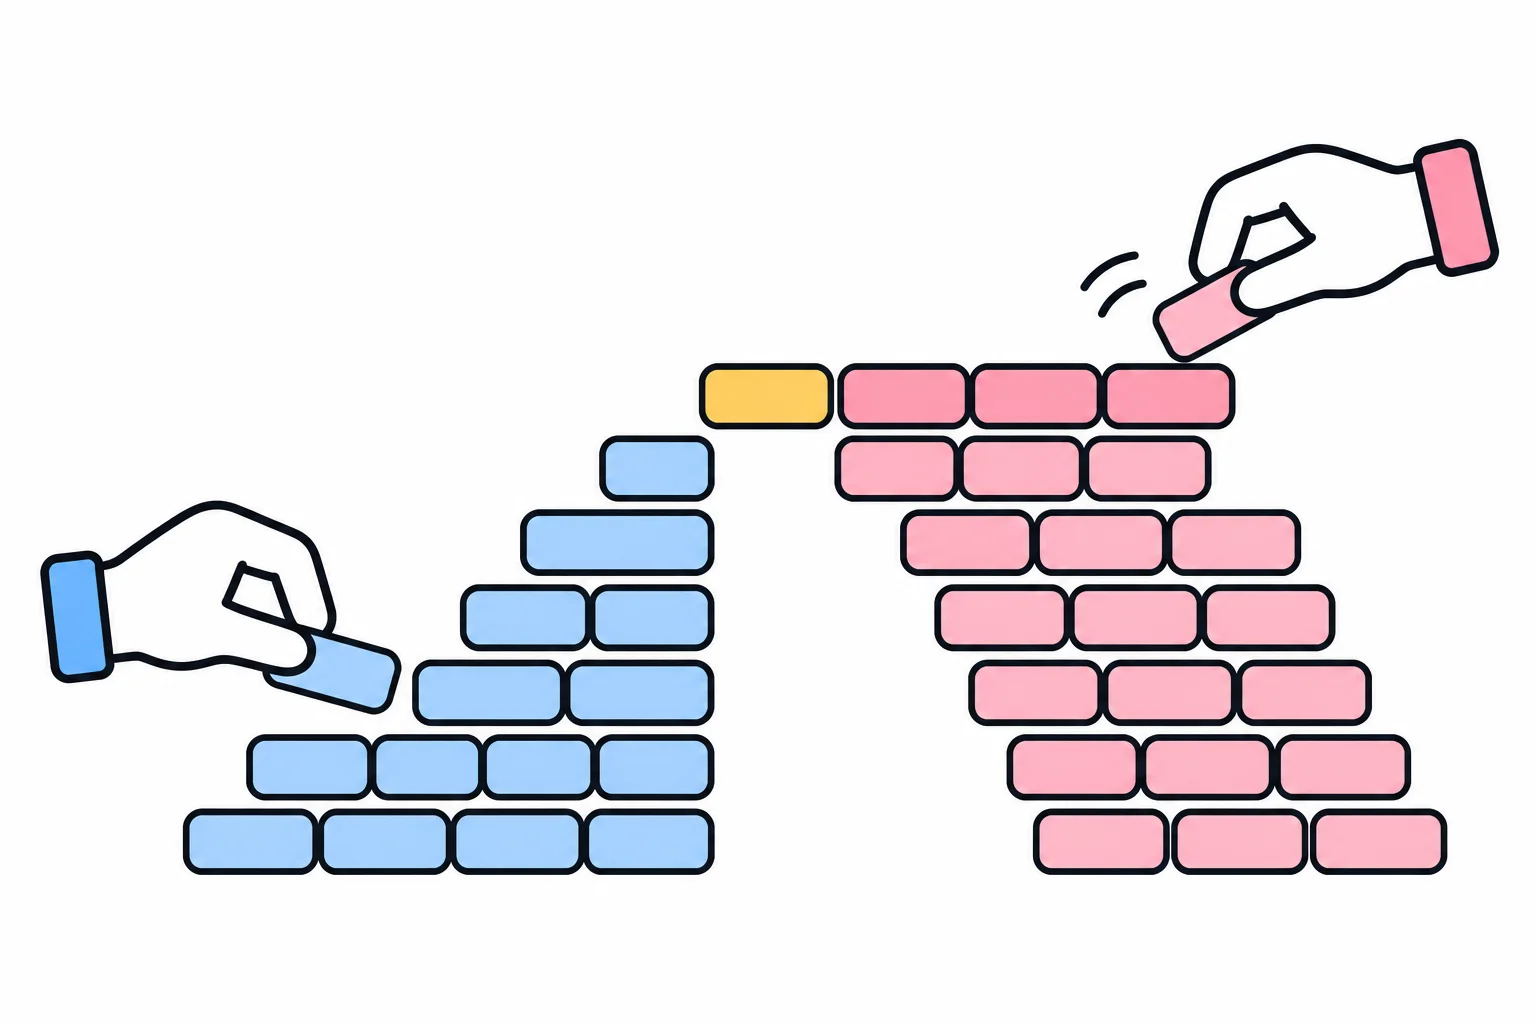
Every price you see is the visible surface of the order book: someone’s resting order got matched, and that match became “the price.” For a first bot you rarely need the full book, but you should know it exists, because it explains the two ways to trade. Place a resting order and wait (maker), or take an existing order and trade immediately (taker). Fees and fills differ between the two, and the order book is where that difference lives. The details get their own guide in this series.
How do you actually get the data?
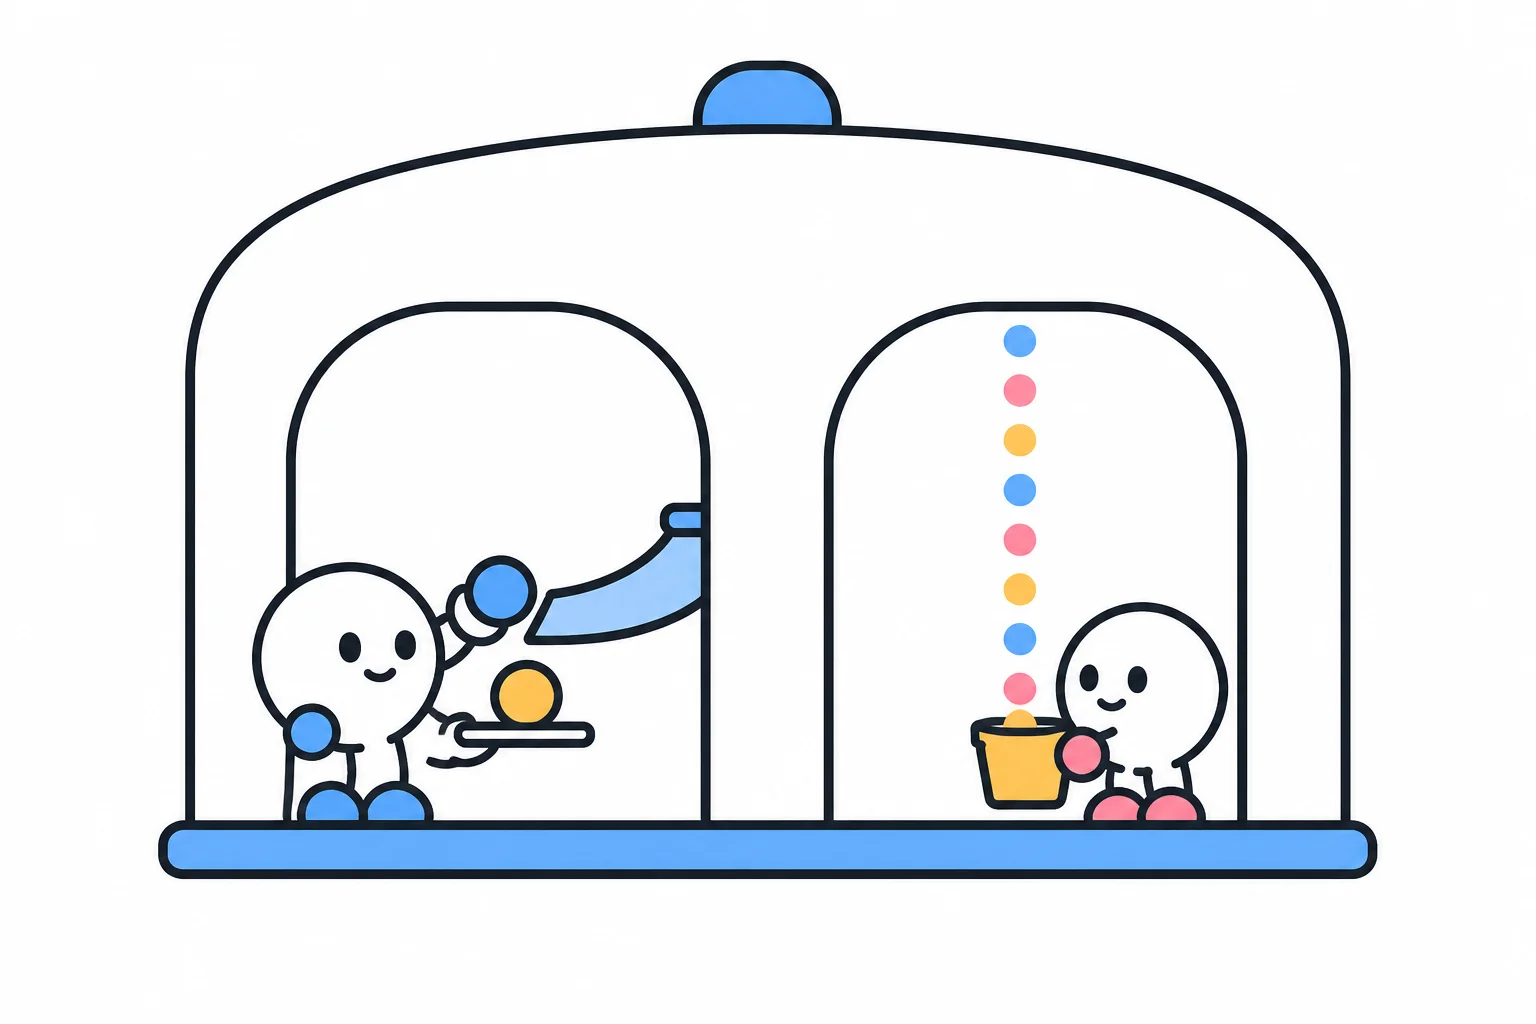
From the exchange, for free. Every major exchange publishes an API with two doors. One answers questions on request: ask for the last 500 candles, receive them. The other streams updates continuously as things happen. On request is simpler and fine for slow bots; streaming is for bots that need to react within seconds.
Historical data for backtesting usually comes from the same API: most exchanges let you request older and older candles in batches at no cost. Third-party aggregators repackage many exchanges into one feed, which is convenient for research across venues. For actually trading, prefer the source: the exchange your orders go to is the market your bot lives in.
Do you need to pay for data?
For a first bot, no. The exchange API covers live prices, candles, the order book, and enough history to backtest with. Paid data services are worth the money in specific situations: deep history at fine resolution, many venues stitched together consistently, or data types the exchange does not expose. All of those are real needs, but not needs a first bot has. Spending money on data before the bot has a working rule is solving a problem you do not have yet.
What should your first bot start with?
Candles and the ticker, fetched on request from the exchange you trade on. That combination backtests cleanly, runs a slow rule live, and skips most of the hard data-engineering problems. Add the streaming door when your rule needs faster reactions, and the order book when you start caring about how your orders fill. The next guide in this series is choosing a strategy: the rule that turns this data into decisions.
FAQ
What is the best free crypto market data API?
For a first bot, the exchange you trade on is usually the best source: its API is free, it describes the market you actually trade in, and live and historical data come from the same place. Judge any source on coverage, history depth, rate limits, and documentation clarity.
How much historical data do I need?
Enough to cover different market conditions, not just the recent trend. A year of hourly candles is a reasonable starting point for slow strategies; fast strategies need finer data over shorter spans. More history helps only if the market behavior it records still resembles today's market.
Is exchange data accurate?
It is authoritative for that exchange, because it records what actually traded there. Prices differ slightly across exchanges, so numbers from one venue will not exactly match another, and aggregated averages will not exactly match either. For trading decisions, the venue where your orders go is the data that matters.